




The math looks insane. Even for people who deal with complex data daily, the figures for American healthcare distribution are jarring. Roughly half of all health care dollars in the U.S. go to just 5 percent of the population. A full 22.8 percent of that spending is concentrated in the top 1 percent. These aren’t new anomalies. They have been the baseline for years.
On the surface, it seems absurd that more than $3 trillion in annual spending flows to such a tiny sliver of people. But if you look closer at those “super-users,” the disparity stops looking like waste and starts looking like biology. It is not a glitch.
“It’s not a passing phase or a one-time phenomenon,” says Gerald F. Kominski, director of UCLA’s Center for Health Policy Research. “Almost everybody gets a cold. Almost everybody gets childhood diseases. But there’s this ‘tail end’ of health care spending — the people who are really, really sick.”
That tail end is heavy. And it is not who you think it is.
Who Are the Super-Users?
Kominski splits these high-cost patients into two distinct buckets. The first group is anyone who gets hospitalized for a condition requiring a couple of days in the hospital. Emergency appendectomies. Car accidents. Childbirth. These are acute events. They are expensive, sure, but they are usually one-off shocks. After the recovery, spending drops back to normal, typical levels.
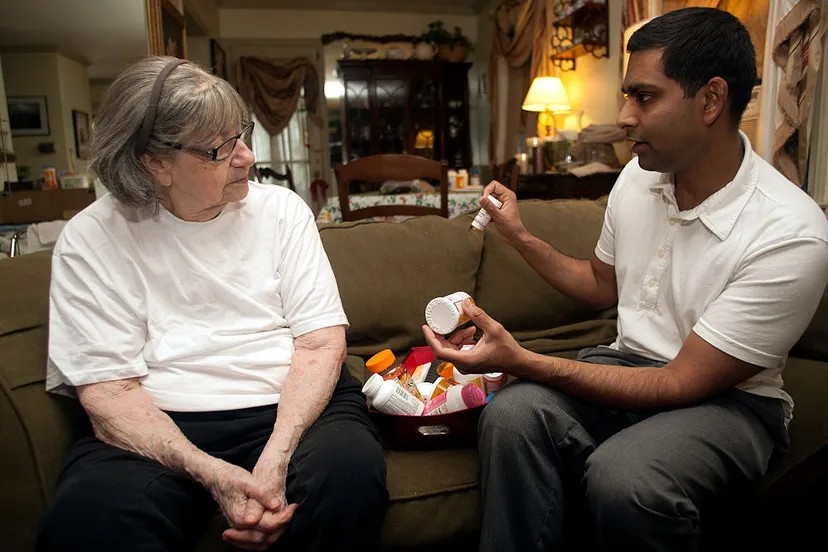
The second group is where the money bleeds out. This is the segment that drives up insurance premiums across the board. These patients need regular physician care. They face repeated, lengthy hospitalizations. They require high-cost pharmaceuticals indefinitely. We are talking chronic diseases like diabetes, heart disease, and cancer.
It is easy to assume these super-users are the elderly or the dying. It is a false assumption. A 2015 study revealed a stark reality: only 11 percent of the highest-cost patients were in their last year of life. Most are not at the end of their lives. They are in the middle of a long, expensive battle with chronic illness.
The scale of the problem is vast. In 2012, the CDC estimated that half of all American adults had at least one chronic health condition. When those conditions go unmanaged or require intensive intervention, the safety net strains. Medicaid takes the hit. Insurance companies raise rates to cover the risk. And everyone else pays the price.
The Cost of Chronic Care
The gap in spending is not just wide. It is bottomless.
Neeraj Sood, vice dean for research at the USC Sol Price School of Public Policy, breaks down the numbers with brutal clarity. The bottom 50 percent of health care users spend an average of about $264 a year. That covers checkups, occasional prescriptions, and minor treatments.
The top 5 percent? They spend about $47,000 a year.
The top 1 percent? Try $107,000 per person, per year.
“It is out of whack in the sense that if you look at other countries… in the U.S., the distribution of expenses is definitely more acute,” Sood notes. In other nations, the distribution might be skewed, but not with this intensity. In the U.S., the bottom 50 percent are largely healthy. But once you fall ill, the American system defaults to high-tech, high-cost interventions.
Every doctor visit adds up. Every X-ray. Every MRI. Every trip to a well-appointed emergency room. Every pill. These costs do not disappear. The government and insurance companies pay them first. Then they pass the bill along.
So, the mostly healthy pay, too. They pay through higher premiums and taxes. They absorb the cost of a system where a small number of people require an outsized amount of resources. It is a financial structure built on the premise that sickness is rare and manageable. The data suggests otherwise.
The Super-User Dilemma in Healthcare Spending
Cutting the bleeding in American healthcare requires confronting a brutal math problem: a tiny fraction of people consume the vast majority of resources. To control costs, experts are zeroing in on these “super-users.” The logic is straightforward. If you can lower the cost of care for the sickest patients, or better yet, keep them out of the hospital entirely through preventative medicine, the system stabilizes.
Preventative medicine is the ideal solution. It is also difficult to implement at scale.
This difficulty has spawned a darker alternative. Some policy advocates suggest sequestering these high-end users. Isolate them from the generally healthy majority. Make them pay significantly more. It sounds efficient on paper. It feels cruel in practice.
“You can make health care more affordable for a large percentage of the population if you can isolate the high spenders. That is one option,” says Kominski. “The other approach is to say, ‘Look, any of us might be in that [high-user] health care category in any given year, despite the fact we may live a healthy lifestyle.’ You can still have a heart attack.”
The risk of exclusion is the counterargument. Before the Affordable Care Act (ACA), the market effectively did this. Insurers avoided the sick or charged them prohibitive rates. The result was a system that collapsed for anyone facing a catastrophic diagnosis. Kominski argues that an all-inclusive approach remains superior, even if it doesn’t magically solve the financial hemorrhaging.
“But it doesn’t, in and of itself, solve the problem.”
Consensus on fixing the broader system remains elusive. However, there is a rare agreement on this specific friction point: managing super-user spending is non-negotiable.
The complexity lies in the nature of the expenditure. Sood points out the fundamental tradeoff that stops most reform efforts.
“The reason why this is a difficult problem to solve is that what is someone’s expense is another person’s income,” Sood says.
Every dollar saved by an insurer or a patient is a dollar not paid to a doctor, a hospital, an insurance company, or Big Pharma. Reducing national healthcare costs means reducing income for those sectors. Society will feel the pain of those cuts. We have to decide if the relief of lower premiums is worth the disruption to the healthcare workforce and industry.
Where the Money Actually Goes
To understand the weight of these decisions, you have to look at the ledger. Who is writing the checks?
Data from the Centers for Medicare & Medicaid Services (CMS) provides a snapshot. In 2015, the federal government absorbed the largest share of healthcare spending—almost 29 percent. It was a tight race. Households came in close behind, covering about 28 percent of the bill. Businesses followed at approximately 20 percent, with state and local governments rounding out the major contributors.
The burden is shared, but the pressure is intense.